9 Interesting Facts about U.S. Infrastructure Spending
As 2015 comes to an end, we wanted to take some time to look at an area that has a significant impact on our pipe piles product division: infrastructure spending. An option for deep foundation support, our ERW straight seam pipe piling products have been used throughout the country in various infrastructure projects, including bridges and structures, as well as other DOT and US Army Corps of Engineers’ projects (if you’d like additional information about these projects, please contact us).
The issue of America’s crumbling infrastructure is no secret. And however suspect our country may be, there’s no question that we’re all hoping to see additional funding allocated and improvements made to our nation’s infrastructure, sooner rather than later.
Since we won’t have concrete data about where infrastructure spending was for 2015 until early 2016, we’re taking it back to 2014 – the latest for which public spending information is available. Going through a report from the Congressional Budget Office, Public Spending on Transportation and Water Infrastructure, 1956 to 2014, we pulled out some of the most interesting and informative facts and statistics about infrastructure spending in 2014 in addition to some historical data.
1. In 2014, public spending on infrastructure totaled $416 billion. This includes spending for transportation and water infrastructure. At the state and local government level, spending totaled $320 billion. Federal spending came in at $96 billion.
2. Infrastructure spending is divided into six types of transportation and water.
• Highways: national, state and local roads, bridges and tunnels
• Mass transit and rail: buses, subways, commuter rail systems, Amtrak
• Aviation: airport terminals, runways, taxiways, air traffic control systems
• Water Transportation: waterways, ports, equipment to support sea-borne traffic
• Water Resources: dams, levees, reservoirs, watersheds, lakes and rivers
• Water Utilities: wastewater and sewage treatment systems and plants
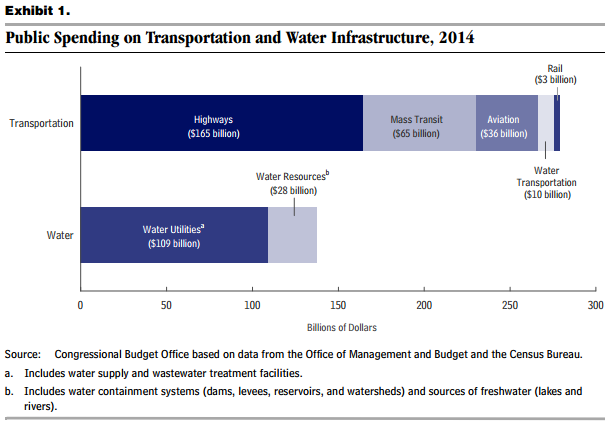
3. In 2014, total public spending by type of infrastructure was as follows:
• Highways: $165 billion which accounted for 40% of total public infrastructure spending in 2014
• Mass Transit: $65 billion
• Aviation: $36 billion
• Water Transportation: $10 billion
• Rail: $3 billion
• Water Utilities: $109 billion
• Water Resources: $28 billion
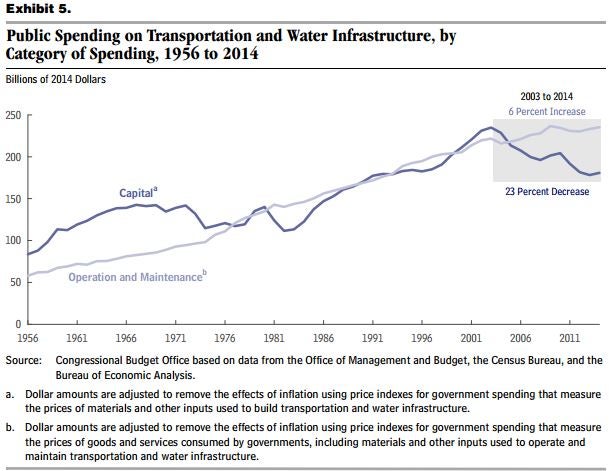
4. With two broad spending categories (physical capital and operation and maintenance), in 2014 physical capital accounted for 43% of spending. Operation and maintenance accounted for the remainder at 57% of total spending.
5. Federal Spending vs. State and Local Spending in 2014:
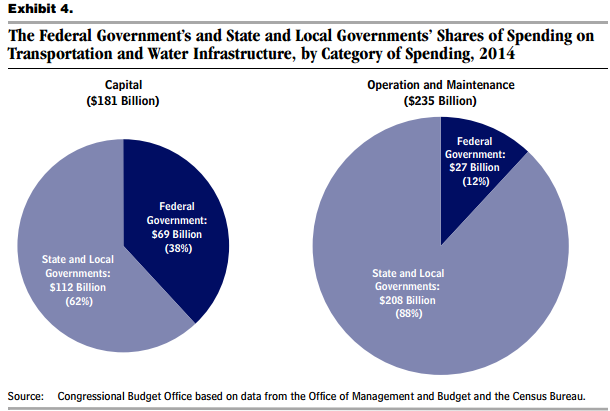
• Physical Capital ($181 billion)
i. Federal Spending = $69 billion (38%)
ii. State & Local Spending = $112 billion (62%)
• Operation and Maintenance ($235 billion)
i. Federal Spending = $ 27 billion (12%)
ii. State & Local Spending =$208 billion (88%)
6. Since 1956, five major Federal legislative acts have affects infrastructure spending.
• Federal-Aid Highways Act of 1956: built the Interstate Highway System in the 50s and 60
• Clean Water Act of 1972: improved water quality and increased spending on water utilities
• Transportation Equity Act for the 21st Century (1998): increased federal support for highway and mass transit projects
• American Recovery and Reinvestment Act of 2009: provided a temporary boost in federal spending on transportation and water infrastructure
• Budget Control Act (2011): established caps on discretionary funding for non-defense programs. This law will be in place until 2021.
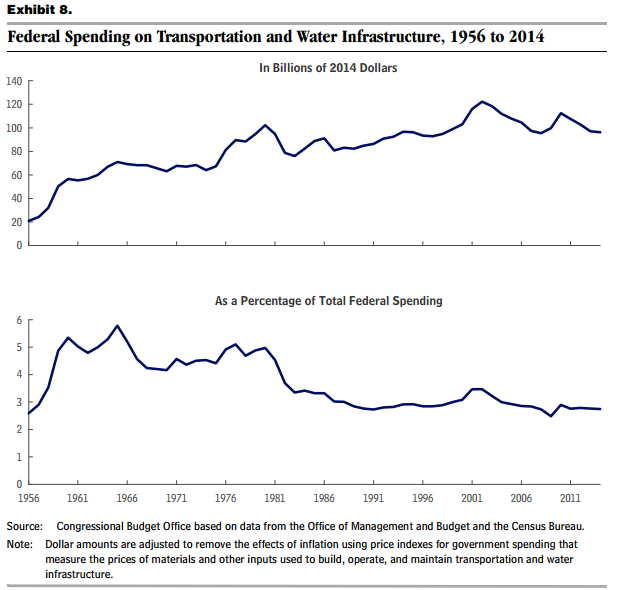
7. Public spending on transportation and water infrastructure accounted for 2.4% of GDP in 2014. In 1959, it accounted for 3.0%. What will it be for 2015?
8. Since 2003, federal government infrastructure spending has decreased 19%, while state and local government infrastructure spending has decreased 5%.
9. The $96 billion spent on U.S. infrastructure in 2014 (by the Federal government) was a 21% decrease from its $122 billion high in 2002.